Is the "high" S&P P/E Ratio a signal of a market top?
- Tom
- Sep 28, 2025
- 3 min read

Since i want to provide educational resources, I'm going to begin this article explaining what P/E ratio means. You can check my X account @tomstockslab and look for my "lemonade stand" analogy, i explained there in simpler ways terms like revenue, EPS, profit margins and more.
The P/E ratio is a valuation metric calculated as the current price of a stock or index divided by its earnings per share (EPS) over the past 12 months (trailing P/E) or projected EPS (forward P/E). For example, a P/E of 29 means investors pay $29 for every $1 of earnings.
The P/E ratio shows how much investors are willing to pay for earnings, indicating if a stock or market is overvalued (high P/E) or undervalued (low P/E) relative to historical norms or peers. Historically, high P/Es (>25–30) correlate with lower long term returns and higher correction risks, while moderate P/Es (~15–20) suggest balanced growth potential.
Seems easy so far, right ? So sell when the P/E gets to high levels and buy when its low. Unfortunately, it isn't that simple lol.
The P/E ratio is indeed a valuable metric but has limitations that make it unreliable as a standalone indicator, especially since markets can remain “pricey” (high P/E) for extended periods when supported by other factors. Here is where most of the professionals fail, i call them "lazy professionals" because they just rely on the index P/E ratio and ignore other factors to simplify things, so yeah, they're lazy.
Bull markets can sustain high P/Es due to investor sentiment and liquidity. The S&P P/E has stayed ≥29 for 13 months since 2021 with positive returns (+17.8% average 12 month) as momentum and policy support (Fed pivots) outweigh valuation concerns. So , as you can see... a high P/E ratio should make us dig deeper, open the hood and look for other dynamics to see if its justified or not. As I always say: context is what defines the outcomes.
Well, so far i said a lot but I haven't specified whats the current P/E ratio for the S&P -my bad, its first article-. As of September 25, 2025, the trailing P/E stands at approximately 29.55. Other sources like Multpl peg it slightly higher at 30.76 as of late September, reflecting intraday fluctuations.
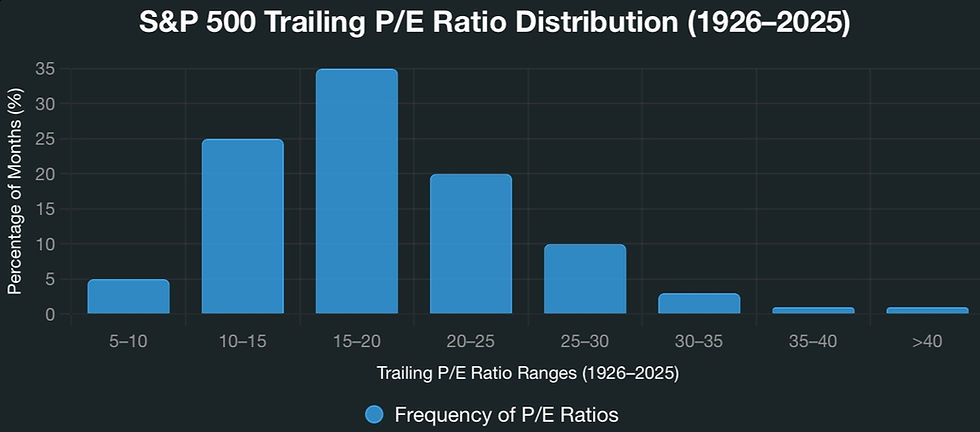
A P/E ratio of 30 for the S&P is on the high side relative to historical norms. The long term average trailing P/E (since 1926) is around 15–20, with a median closer to 17 (per Multpl.com and Shiller data). A P/E of 30 exceeds the 75th percentile of historical values (~25), placing it in overvalued territory by historical standards.
Historical Instances of S&P Trailing P/E Ratio Reaching 29+ in the last 20 Years (2005–2025)
Based on monthly historical data the trailing P/E has reached or exceeded 29 on 20 distinct occasions over the last 20 years. These episodes are clustered in two primary periods:
• 2008–2009 (Financial Crisis): 7 months (Feb–Aug 2009), driven by sharply depressed earnings (P/E peaked at 123.73 in May 2009 due to near zero TTM EPS).
• 2021–2025 (Post-Pandemic Bull Market): 13 months (scattered from Jan 2021 onward, with sustained highs in 2024–2025), fueled by strong earnings growth but offset by rapid price appreciation in tech-heavy indices.
To capture “what happened after” across all instances, I averaged forward returns from each of these 20 months. This provides a probabilistic view, accounting for both crisis rebounds and bull-market momentum.

On those previous instances short-term performance was positive on average (momentum effect), but with 10–15% chance of negatives. Long-term, expect tempered returns (3–7% annualized) until P/E compresses toward 18–20 historical median.
The S&P is currently overvalued by historical standards, this should signal caution. However, a high P/E alone isn’t a sell signal. Markets can remain “pricey” for extended periods, as seen in the 13 months since 2021 where P/E ≥29 coincided with strong returns, fueled by robust earnings growth and bullish sentiment. This underscores the danger of relying solely on P/E without context. Factors like forward P/E (~22 for 2026), sector dynamics (AI-driven tech gains), and macroeconomic conditions (Fed policy) must be considered to determine if valuations are justified.
As I always emphasize, context defines outcomes. So, dig deeper, check under the hood, and pair P/E with other metrics to make informed decisions.
@tomstockslab


Nice start! Congratulations!